Twice the charging power of the original XS!
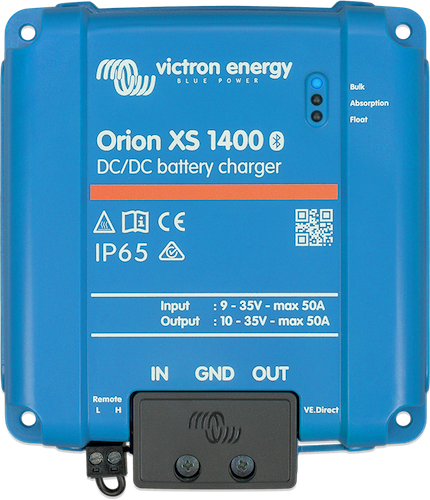
Expanding on the Orion XS 12/12-50A, the new Orion XS 1400 supports 12V and 24V systems. The Orion XS 1400 uses automatic buck-boost control to allow 12/24V input and 12/24V output, and provides twice the charging power of the original XS in 24V/24V configuration.
The Orion XS 1400 can be used as a battery charger or a power supply, delivering up to 1400W of continuous power at 28V. The output voltage is fully adjustable and remains independent of the input voltage, thanks to the automatic buck-boost control. This also ensures the current never exceeds the set value, even when the input voltage is higher than the output.
In power supply mode, the output voltage stays stable regardless of load or input fluctuations, within the specified range. In charger mode, the four-stage charge algorithm improves battery life through controlled charging.
As a key component of the Victron ecosystem, the Orion XS 1400 is configured and monitored via Victron Connect, locally via a GX device, such as the Cerbo GX, Ekrano GX, or remotely via the VRM Portal.
Key features:
• Engine shutdown detection with no external sensor required
• Smart four-stage charging algorithm
• Can be paralleled with no limit on number of units
• DVCC compatible via GX device via VE.Direct
• IP65 rated, dust-tight and protected against heavy rain
• Fanless, silent, and with up to 98.5% efficiency
For datasheet and more information, please visit the Orion XS 1400 product page: Orion XS 1400 DC-DC Battery Charger